|
|
|
|

|
 |
CSIR
WAVENET |
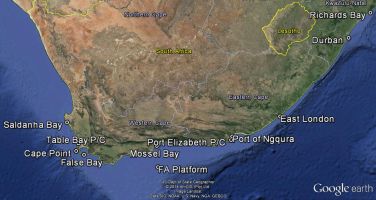
Select
a station from
the map to view the graphs for the measured parameters
|
|
Information about the Time Series Data presented in
these pages
|
|
|
|

|
Data are displayed without any kind of Quality
Control. |

|
Extreme values of any parameter are not
plotted. |

|
A missing parameter from a graph denotes a
problem in a specific sensor |

|
Only the last 2 - 3 days of data time series
are shown.
|

|
For selected stations, the 24 hour forecast is also shown.
|

|
The data is updated hourly, on the hour.
|
|
|


