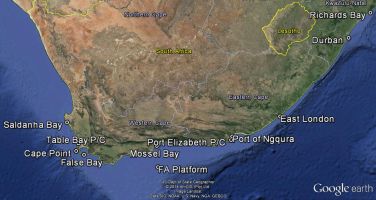
Table Bay
About

Development of an operational SWAN model for Table Bay: Virtual Buoy System
Information on wave conditions at the entrance of a port is important for the safe navigation of vessels. However, due to shipping in this confined area, it is difficult to monitor wave conditions right in the entrance channel. Therefore, the concept of a 'virtual buoy' system has been developed. The 'virtual buoy' at a particular location is not a real wave monitoring buoy, but represents a numerical process whereby the wave conditions are determined at the location with a high degree of accuracy.
The 'virtual buoy' concept has been implemented at the entrance to the Port of Cape Town. Initially, a number of options were evaluated for providing data on the wave conditions inside Table Bay and near the entrance channel to the port. These included the deployment of a surface wave buoy or an Acoustic Doppler Current Profiler (ADCP) on the sea-bed. Due to the high risk of damage and high maintenance costs, a more innovative solution was required.
The solution adopted entailed the numerical transformation of the monitored deep-water Cape Point wave data to nearshore wave conditions inside Table Bay on a real-time basis. This wave transformation was achieved through the SWAN wave refraction model.
Deep-sea waves approach Table Bay from the south-west to the north-west. Since the south-westerly waves are reduced significantly as a result of refraction, a considerable variation in wave conditions can be experienced inside the bay.
The directional wave data from the Cape Point wave buoy are sent to the Stellenbosch office of the CSIR where the data are processed with the operational SWAN model. The model runs on a dedicated PC which is linked to the CSIR Integrated Port Operation Support System (IPOSS). Once the model output is available (after approximately 5 minutes), the wave parameters are transferred to IPOSS and displayed jointly with the offshore (Cape Point) wave data, the weather and tidal information.
It is recognised that the Virtual Buoy system will not provide data as accurate as measured data. However, the calibration and validation exercises indicated the present output represents the actual conditions reasonably well.
Although a number of output locations are available, the wave parameters of only two locations are shown on the graphs. Since the output from the system is similar in appearance to that of the measured offshore data, the output locations are in essence imaginary wave buoys or 'Virtual Wave Buoys'.
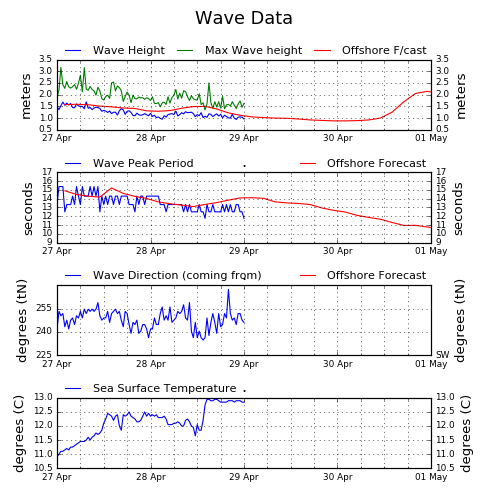
Wave Data
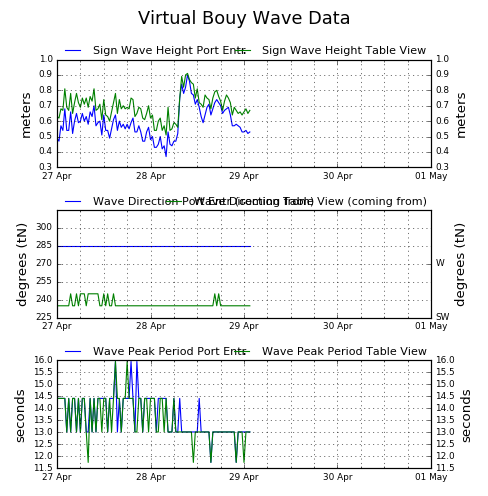
Virtual Bouy Data
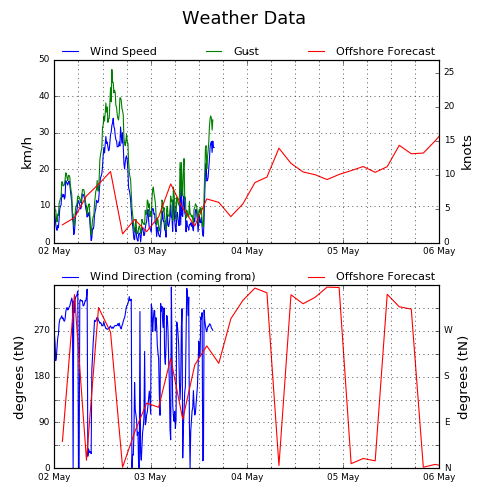
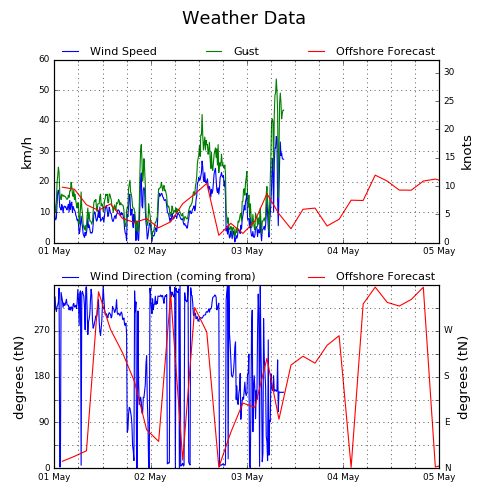
Weather Data (Port Control)
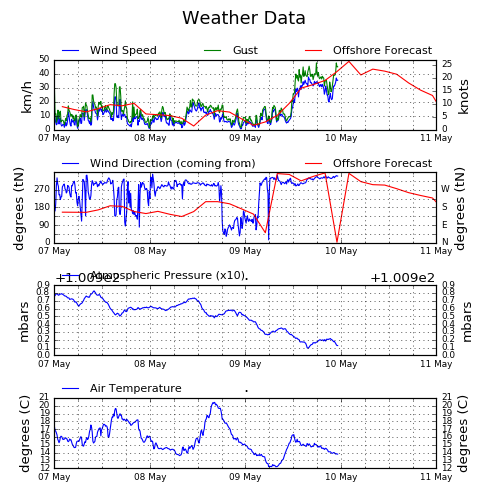
Weather Data (Cont Term)
Weather Data (South Spur)
Contact: Sarel Haasbroek, Telephone: +27 21 888 2440
Page maintained by Ursula von St Ange
Copyright@CSIR
2015. All right Reserved | Feedback:
WebDeveloper
Disclaimer: These are only estimated figures and should explicitly be
used for display purposes only. No assumption and/or conclusion should
be made.
Table Bay